Διαγράμματα με γραμμές (line plots) στο Octave/Matlab
1) Μια απλή γραφική παράσταση
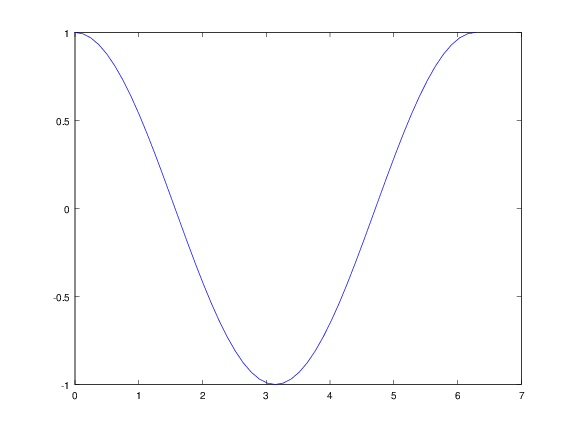
clear; cla; clf;

x = linspace(0, 2*pi, 101)';
y = cos(x);

plot(x, y);
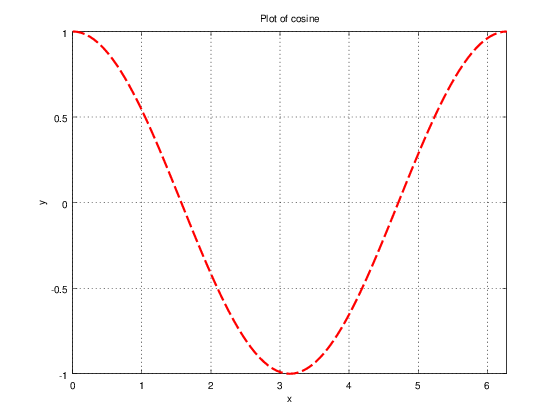
2) Μορφοποίηση διαγράμματος
clear; cla; clf;

x = linspace(0, 2*pi, 101)';
y = cos(x);

plot(x, y, 'r--', 'LineWidth', 2);
grid on;
title("Plot of cosine");
xlabel("x");
ylabel("y");
axis([0 2*pi -1 1]);
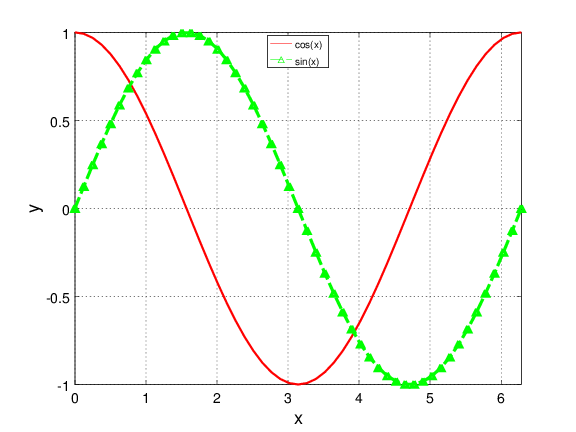
3) Δύο γραφικές παραστάσεις στο ίδιο γράφημα
clear; cla; clf;

x  = linspace(0, 2*pi, 51)';
y1 = cos(x);
y2 = sin(x);

plot(x, y1, 'r', 'LineWidth', 2, x, y2, 'g--^', 'LineWidth', 2);
grid on;
xlabel("x", 'FontWeight', 'bold', 'FontSize', 18);
ylabel("y", 'FontWeight', 'bold', 'FontSize', 18);
axis([0 2*pi -1 1]);
legend("cos(x)", "sin(x)", 'Location', 'North');
set(gca, 'FontSize', 14);
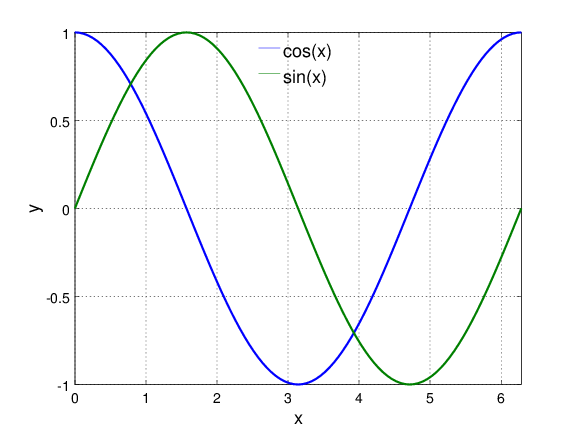
4) Διάγραμμα μεταβλητής μήτρας
clear; cla; clf;

x = (0:pi/50:2*pi)';
y = [cos(x) sin(x)];

plot(x, y, 'Linewidth', 2);
grid on;
xlabel("x", 'FontWeight', 'bold', 'FontSize', 18);
ylabel("y", 'FontWeight', 'bold', 'FontSize', 18);
axis([0 2*pi -1 1]);
h = legend("cos(x)", "sin(x)", 'Location', 'North');
legend(h, 'boxoff');
set(h, 'FontSize', 18);
set(gca, 'FontSize', 14);
5) Ισορροπία της αγοράς
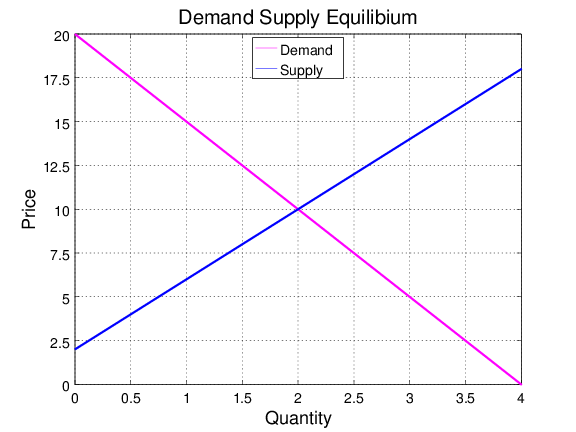
clear; cla; clf;

q = (0:1:5)';
D = 20 - 5*q;
S = 2  + 4*q;

plot(q, D, 'm','LineWidth', 2, q, S, 'b', 'LineWidth', 2);
grid on;
title("Demand Supply Equilibium", 'FontSize', 20);
xlabel("Quantity", 'FontWeight', 'bold', 'FontSize', 18);
ylabel("Price", 'FontWeight', 'bold', 'FontSize', 18);
axis([0 4 0 20]);
h = legend('Demand', 'Supply', 'Location', 'North');
set(h, 'FontSize', 14);
set(gca, 'FontSize', 14);
set(gca, 'xtick', 0:0.5:4);
set(gca, 'ytick', 0:2.5:20);
6) Διαφορετικές παραστάσεις πάνω στο ίδιο άξονα
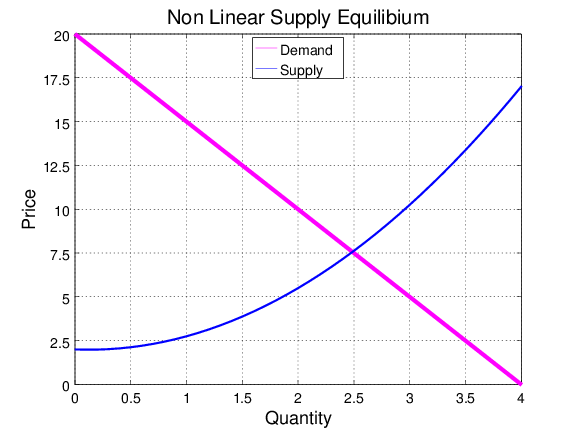
clear; cla; clf;

qD = (0:1:5)';
D  = 20 - 5*qD;
qS = (0:0.1:5)';
S  = 2 - 0.25*qS + qS.^2;

plot(qD, D, 'm','LineWidth', 4, qS, S, 'b', 'LineWidth', 2);
grid on;
title("Non Linear Supply Equilibium", 'FontSize', 20);
xlabel("Quantity", 'FontWeight', 'bold', 'FontSize', 18);
ylabel("Price", 'FontWeight', 'bold', 'FontSize', 18);
axis([0 4 0 20]);
h = legend('Demand', 'Supply', 'Location', 'North');
set(h, 'FontSize', 14);
set(gca, 'FontSize', 14);
set(gca, 'xtick', 0:0.5:4);
set(gca, 'ytick', 0:2.5:20);
7) Γράφημα γραμμών με επισήμανση σημείων
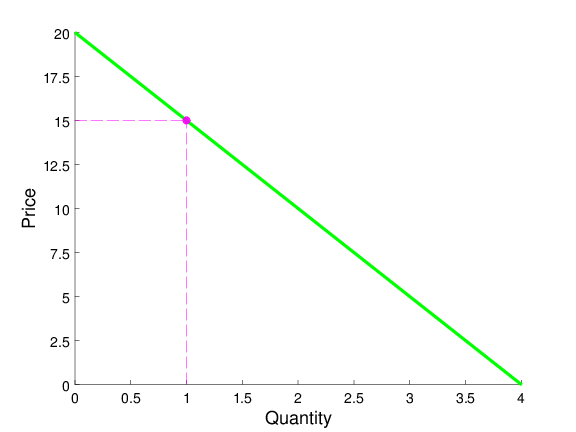
clear; cla; clf;

a  = 20;
b  =  5;
q  = (0:1:5)';
D  = a - b*q;
qs = 1;
ps = a - b*qs;

xV = [qs qs];
yV = [ 0 ps];
xH = [ 0 qs];
yH = [ps ps];

plot(q, D, 'g-','LineWidth', 3,
     qs, ps, 'm.', 'MarkerSize', 12,
     xH, yH, 'm--', xV, yV, 'm--');
box off;
xlabel("Quantity", 'FontWeight', 'bold', 'FontSize', 18);
ylabel("Price", 'FontWeight', 'bold', 'FontSize', 18);
axis([0 4 0 20]);
set(gca, 'FontSize', 14);
set(gca, 'xtick', 0:0.5:4);
set(gca, 'ytick', 0:2.5:20);
8) Σταδιακή προσθήκη στοιχείων γραφήματος (hold on)

clear; cla; clf;

a  = 20;
b  =  5;
q  = (0:1:5)';
D  = a - b*q;
qs = 1;
ps = a - b*qs;

xV = [qs qs];
yV = [ 0 ps];
xH = [ 0 qs];
yH = [ps ps];

plot(q, D, 'g-','LineWidth', 3);
box off;
xlabel("Quantity", 'FontWeight', 'bold', 'FontSize', 18);
ylabel("Price", 'FontWeight', 'bold', 'FontSize', 18);
axis([0 4 0 20]);
set(gca, 'FontSize', 14);
set(gca, 'xtick', 0:0.5:4);
set(gca, 'ytick', 0:2.5:20);
hold on;

plot(qs, ps, 'm.', 'MarkerSize', 12);
plot(xH, yH, 'm--');
plot(xV, yV, 'm--');
text(qs+0.1, ps+0.5, 'A', 'FontSize', 18);
hold off;
Συνδεθείτε για περισσότερες δυνατότητες αλληλεπίδρασης,
σχολιασμοί, εξωτερικοί σύνδεσμοι, βοήθεια, ψηφοφορίες, αρχεία, κτλ.
σχολιασμοί, εξωτερικοί σύνδεσμοι, βοήθεια, ψηφοφορίες, αρχεία, κτλ.

Εκπαιδευτικό υλικό από τον
Αθανάσιο Σταυρακούδη
σας παρέχετε κάτω από την άδεια
Creative Commons Attribution-NonCommercial-ShareAlike 4.0 License.
Σας παρακαλώ να ενημερωθείτε για κάποιους επιπλέον περιορισμούς
http://stavrakoudis.econ.uoi.gr/stavrakoudis/?iid=401.