Διαγράμματα διασποράς (scatter plot) με το Octave/Matlab
Ένα απλό διάγραμμα διασποράς
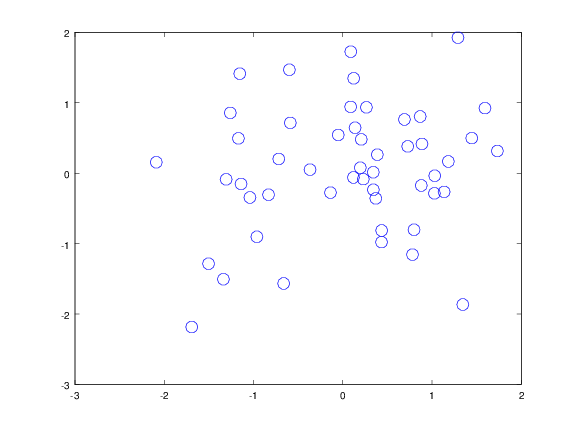
clear;
randn('seed', 1);

x = randn(50, 1);
y = randn(50, 1);

scatter(x, y, 6, 'b');
Plot το ίδιο αποτελέσμα με scatter
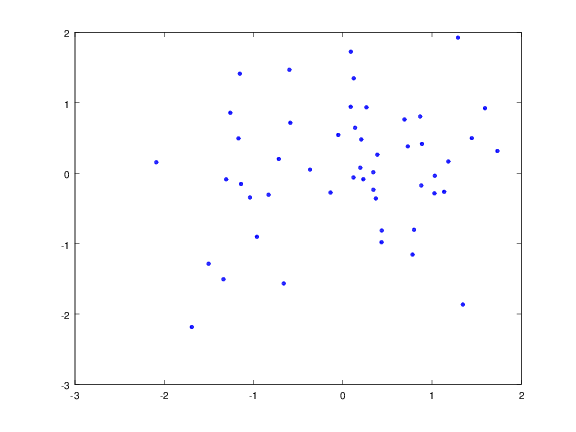
clear;
randn('seed', 1);

x = randn(50, 1);
y = randn(50, 1);

plot(x, y, 'o');
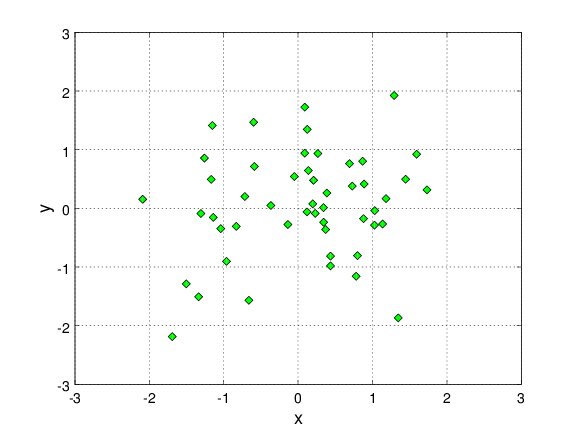
Παράδειγμα μορφοποίησης διαγράμματος διασποράς
clear;
randn('seed', 1);

x = randn(50, 1);
y = randn(50, 1);

plot(x, y, 'd',   'MarkerFaceColor', 'g', 'MarkerEdgeColor', 'k', 'MarkerSize', 8);
grid on;
xlabel('x', 'FontWeight', 'bold', 'FontSize', 18);
ylabel('y', 'FontWeight', 'bold', 'FontSize', 18);
set(gca, 'FontSize', 14);
set(gca, 'FontWeight', 'bold');
axis([-3, 3, -3, 3]);
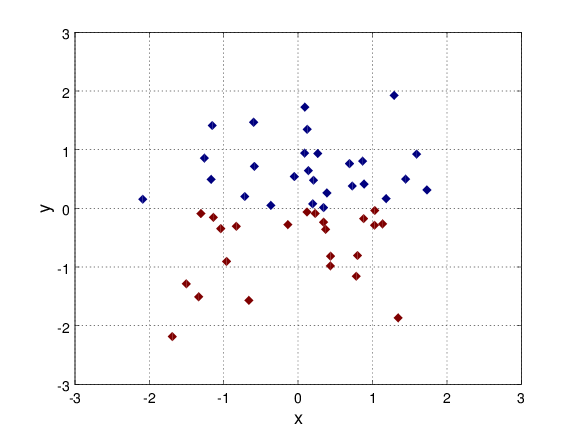
Διαφοροποίηση σημείων σε διάγραμμα διασποράς
clear;
randn('seed', 1);

T = 50;
x = randn(T, 1);
y = randn(T, 1);
c = ones(T, 1) + (y<0);

scatter(x, y, 9, c, 'd', 'filled');
grid on;
xlabel('x', 'FontWeight', 'bold', 'FontSize', 18);
ylabel('y', 'FontWeight', 'bold', 'FontSize', 18);
set(gca, 'FontSize', 14);
set(gca, 'FontWeight', 'bold');
axis([-3, 3, -3, 3]);
Σημεία εντός μιας περιοχής σε διάγραμμα διασποράς
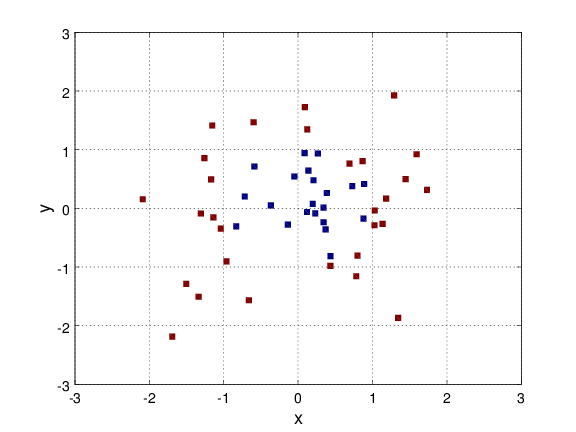
clear;
randn('seed', 1);

T = 50;
x = randn(T, 1);
y = randn(T, 1);
d = sqrt(x .^ 2 + y .^ 2);
c = ones(T, 1) + (d>1);

scatter (x, y, 6, c, 's', 'filled');
grid on;
xlabel('x', 'FontWeight', 'bold', 'FontSize', 18);
ylabel('y', 'FontWeight', 'bold', 'FontSize', 18);
set(gca, 'FontSize', 14);
set(gca, 'FontWeight', 'bold');
axis([-3, 3, -3, 3]);
Διάγραμμα διασποράς με λεκτικά ως σημεία, έλλειμμα και χρέος στην Ευρωζώνη
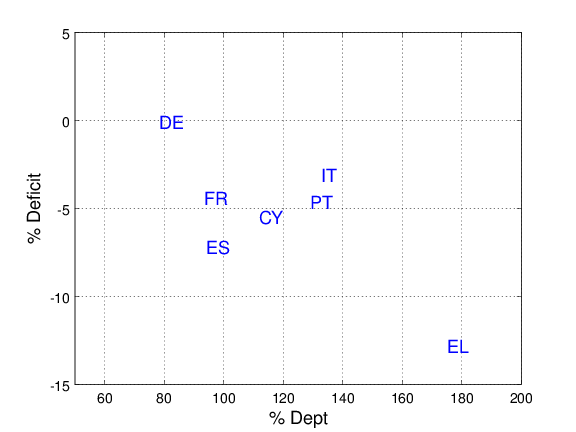
clear;

plot (NA, NA);
grid on;

country = {'DE', 'FR', 'PT', 'ES', 'IT', 'EL', 'CY'};
dept     = [78.4  93.5 129.0 93.9 132.6 175.1 111.7];
deficit   = [ 0.0   -4.3    -4.5  -7.1   -3.0  -12.7   -5.4];

text(dept, deficit, country, 'Color', 'b', 'FontSize', 18, 'FontWeight', 'bold');
xlabel('% Dept', 'FontWeight', 'bold', 'FontSize', 18);
ylabel('% Deficit', 'FontWeight', 'bold', 'FontSize', 18);
set(gca, 'FontSize', 14);
set(gca, 'FontWeight', 'bold');
axis([50, 200, -15, 5]);
Συνδεθείτε για περισσότερες δυνατότητες αλληλεπίδρασης,
σχολιασμοί, εξωτερικοί σύνδεσμοι, βοήθεια, ψηφοφορίες, αρχεία, κτλ.
σχολιασμοί, εξωτερικοί σύνδεσμοι, βοήθεια, ψηφοφορίες, αρχεία, κτλ.

Εκπαιδευτικό υλικό από τον
Αθανάσιο Σταυρακούδη
σας παρέχετε κάτω από την άδεια
Creative Commons Attribution-NonCommercial-ShareAlike 4.0 License.
Σας παρακαλώ να ενημερωθείτε για κάποιους επιπλέον περιορισμούς
http://stavrakoudis.econ.uoi.gr/stavrakoudis/?iid=401.